Modeling and Mapping Eviction Rates in California
Our goal is to visualize predicted eviction rates in California.
3 Stages of Eviction

Notice
Landlord gives 3 - 60 days' written notice

Filing
Landlord files a complaint legally, notifies sheriff's department

Removal
Sheriff has tenant forcefully evicted
Motivation
Due to the COVID-19 pandemic, a rent moratorium was set in place in California to prevent mass evictions. The moratorium is set to expire on September 30th, 2021.
Tract-level eviction effects of the moratorium lifting are unclear.
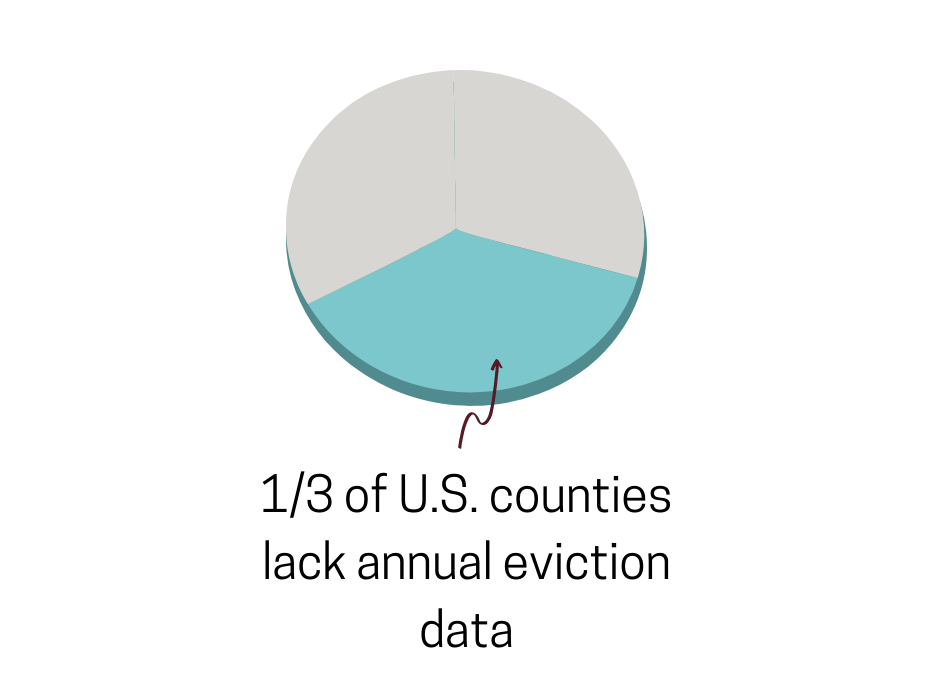
Eviction data is sparse.
In California specifically, accurate eviction data is also sparse & unvalidated. The danger of not knowing tract-level eviction rates is creating policy that may harm, ignore, and underserve high risk neighborhoods.
Our goal
Predict eviction rates for each tract in California.
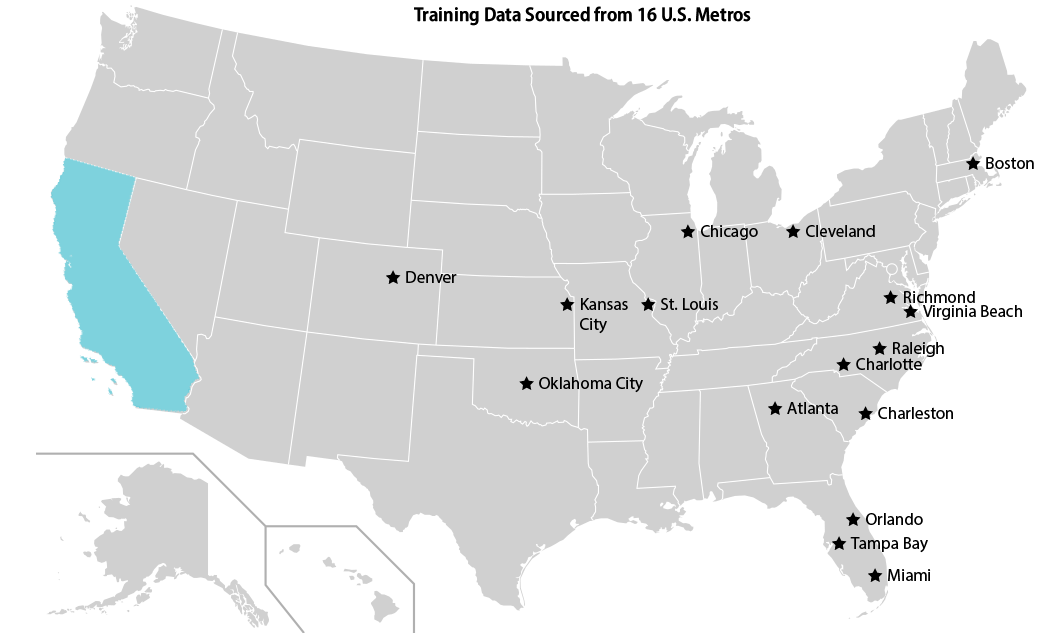
We sourced validated eviction data on 16 metros nationwide from the renowned U.C. Berkeley Urban Displacement Project. Utilizing cutting-edge machine learning techniques, we constructed a model to generate predictions over California.
Caveats

Conservative Estimates
Since the data we have is only on the last step of the eviction pipeline, our estimates are likely underestimates of the true number of residents made to leave their homes.

Variation in Accuracy
Our training data is from 16 cities. Thus, the model may make more accurate predictions on denser California cities and less accurate predictions on suburbs or rural regions.

2019 Estimates
The predicted values on the map are based on 2019 data. We don’t claim our estimates are exactly reflective of the current year.